Multi-campus collaboration tells story of cancer in central Pennsylvania
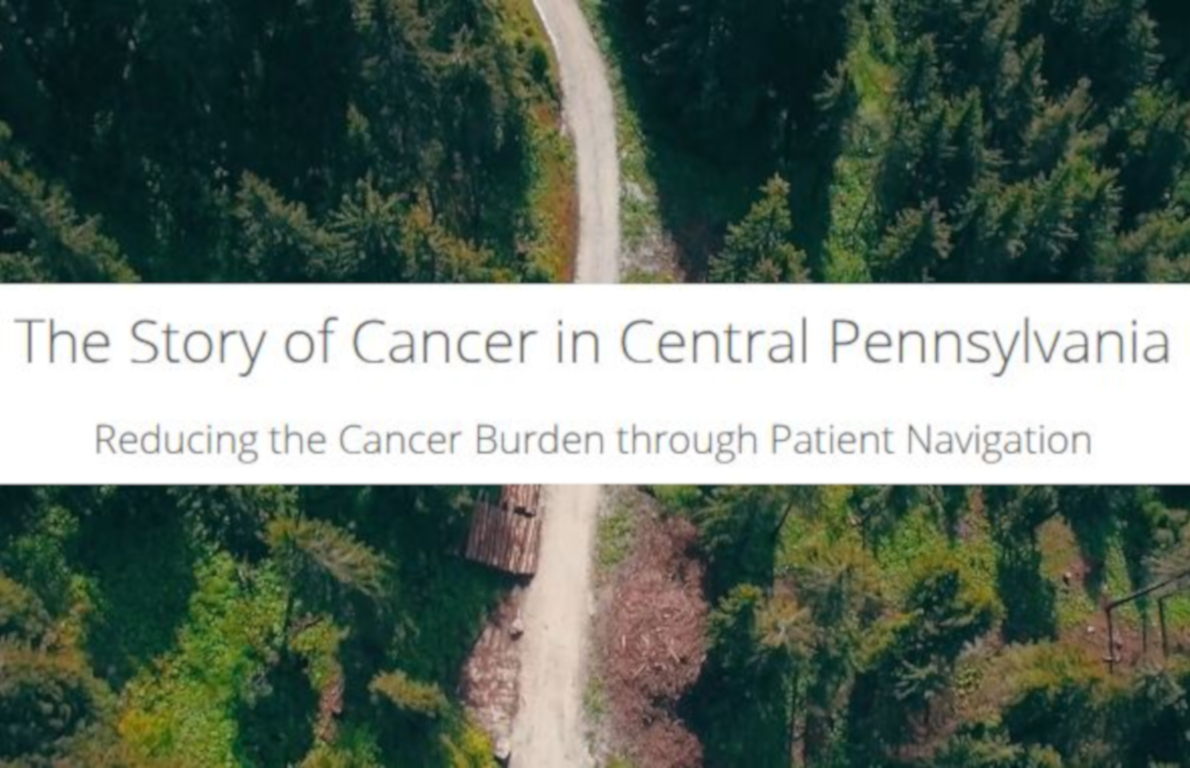
Penn State has launched its first cancer-related Story Map, “The Story of Cancer in Central Pennsylvania.” The interactive geospatial map illustrates the extent of the cancer problem in the region. It also highlights patient navigators who help people overcome barriers to cancer care and action steps to help address cancer in the community.
Using a browser-based software called Esri ArcGIS Online, the Story Map pairs geospatial data with text and multimedia content. It allows viewers to drill down to population and cancer data at the county and sub-county levels.
The Story Map presents cancer cases in the 28-county catchment area of Penn State Cancer Institute from the perspective of three populations – those who live in rural communities, Hispanics/Latinos, and African-Americans/blacks. It also includes links to secondary Story Maps that highlight the cancer control continuum ‒ cancer prevention, screening and early detection, diagnosis and treatment, and survivorship.
Three student interns developed the map over the summer semester ‒ Sara Costalas from Penn State College of Medicine’s Master of Public Health program, Brittany Waltemate, a Penn State geography student, and Pinwei Wu of Statistics of Penn State’s Master of Applied Statistics program. They worked under the direction of Eugene Lengerich, public health sciences professor at the College of Medicine, and the Community Sciences and Health Outcomes Shared Resource at Penn State Cancer Institute.
The Story Map will be used to engage and inform community residents, public health officials and funders. It is best viewed on a desktop/laptop computer using up-to-date Chrome or Firefox browsers. If the Story Map doesn’t load, viewers can also download a pdf version.
If you're having trouble accessing this content, or would like it in another format, please email Penn State Health Marketing & Communications.