| Mapping | |
Fishponds extraction using rule based classification and support vector machine of LiDAR data
The objective of the study is to extract large scale fishponds using Object Based Image Analysis. |
 |
|
 |
|
 |
|
 |
|
 |
|
 |
|
 |
|
Mapping of fishponds are valuable to achieve proper monitoring and inventory of fish production. Due to yearly changes in the fishpond structures and operation, inventory of these aquacultures tend to become time consuming laborious. On the other hand, the possibility of using remotely sensed data to generate maps of aquatic resources must be explored considering that remote sensing data were proven to be useful in generating high accuracy maps of land covers.
LiDAR data is one of the remotely sensed data that were frequently used in mapping which has 0.5m x 0.5m resolution. LiDAR data is produced by projecting laser that transmits very short pulses in optical or near infrared part of the electromagnetic spectrum (Rees, 1999). Using LiDAR data, different raster layers can be produced and used in mapping of land covers in various ways of classification processes. “Support Vector Machine” and “Rule Based Classification” are some of the classification processes that are commonly used in mapping purposes. Support Vector Machine (SVM) on the other hand, is one of the best machine learning algorithms in which a given set of training examples, the machine also analyzed the data and create new examples based on the similarities of patterns and categories in the given set of training samples (Pradhan, 2012). “Rule Based Classification” is a process that is highly expressive as decision trees which is easy to interpret, generate and can immediately classify objects (www.mimuw.edu.pl).
Mapping aquatic structures can also be performed with good accuracy and at regular intervals by satellite remote sensing, which allows observation of vast areas and even areas of difficult accessibility at a fraction of the cost of traditional surveys (Travaglia et. al, 2004). This study was conducted to develop a protocol in extracting large numbers of fishponds by combining the SVM and “Rule Based Classification” using LiDAR Data.
Objectives
The objective of the study is to extract large scale fishponds using Object Based Image Analysis by combining with SVM and Rule Based in classification approaches.
Materials and methods
Data and study area
The data used in this study are LiDAR data from the Phil-LiDAR 1, Data Acquisition Component, University of the Philippines Diliman, Philippines. The selected study site was a 31.04km2 land cover area in the municipalities of Samal and Abucay, Bataan. Both municipalities lies in coastal zone having numerous fishpond structures (Figure 1).
General Methodology
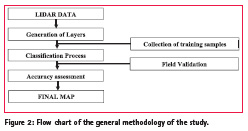
The methodologies used in this study are the same methods used in classification processes for mapping land covers using various remotely sensed data. Some modifications in the methods were carried out to achieve the objectives of the study. Figure 2 shows the flow chart of the general methodology of the study.
Derivation of Layers
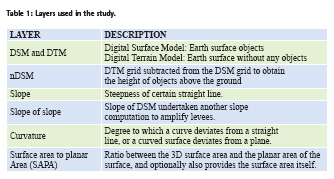
LiDAR data was used to generate layers using LasTools and ArcGIS softwares. Digital Surface Model (DSM) and Digital Terrain Models (DTM) were derived using Blas2Dem and processed in ArcGIS to generate various layers. All layers produced were mainly height dependent to magnify fishpond levees. Description of all layers used in classification is shown in Table 1.
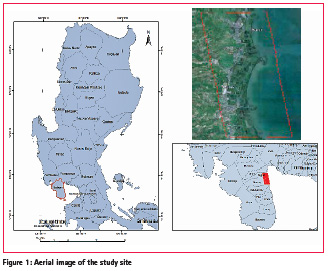
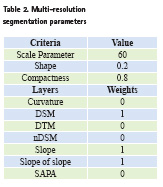
Image Segmentation Method
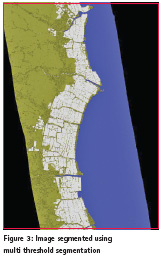
Two pronged approach in image segmentation were used in the classification process using eCognition developer. Multi-threshold was used in separating large objects based on pixel/layer values and this segmentation approach was used in separating ocean bodies from the land cover mass through DSM layer. Using Rule Based classification, objects were classified as higher ground, ocean bodies and fishpond areas based in the DSM and geometric features (Figure 3).
Multi-resolution segmentation (MRS) was used to compensate the fishpond areas which were incompletely segmented. Objects of interest typically appear segmented from the other objects by controlling the scale parameter and layer weights (Baatz and Schape, 2002). In eCognition software, three criteria must be satisfied to have a good set up and these are: scale parameter, shape and compactness. These three criteria are very vital in having a good segmentation. Therefore, height dependent layers were used in the segmentation process to properly dissect fishpond levees. Table 2 shows the parameters and layer weights used in segmenting the levees from the classified fishpond areas.
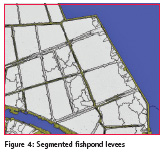
In Multi-resolution segmentation, the values and weights dictates the degree or influence of the criteria and layers in the segmentation, thus, trial and error are needed in the process to choose the best results. Figure 4 shows the result of the MRS by applying the values and weights in the fishpond areas.
Support Vector Machine (SVM) Classification Process
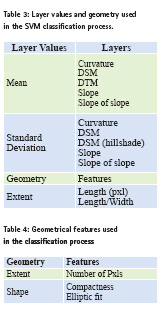
Support Vector Machine (SVM) is one of the best machine learning algorithms that automatically classify segmented objects. SVM is a technique suitable for binary classification tasks, which is related to and contains elements of non-parametric applied statistics, neural networks and machine learning (Auria et.al, 2008). From the segmented objects of the fishpond areas, this approach can classify the fishpond levees from the water bodies. Given the height dependent layers generated from the LiDAR data, classification of levees, water bodies, unwanted triangulations and other water artifacts e.g. boats, bamboo, kubo will be much better. Layers used in the SVM classification process have undergone trial and error to select the best results. Table 3 shows the layer values and geometry assigned for the SVM classification process.
Rule Based Classification Process
Extraction of fishpond levees and other water artifacts was carried out using SVM. The remaining water bodies e.g. fishponds, river ways and small water reservoir were further classified using “Rule Based Classification” which function as decision trees that is easy to interpret and quick to execute. Table 4 displays the geometrical features used in the classification process.
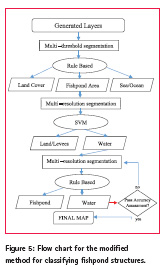
Geometrical features are vital for extracting fishpond structures from other water bodies because of their polygonal shape. On the other hand, river or water ways were observed elliptical and linear, while small water embankment has an indefinite or irregular in shape. Therefore, the rule based classification approach was observed as effective way to extract fishpond structures and be classified individually. Flow chart for the classification process is shown in Figure 5.
Results and discussion
Results of segmentation and classification
In image segmentation, Multi-threshold segmentation was found to be the best way to separate different classes in large homogenous object. On the other hand, generated layers such as slope, DSM, and slope of slope were observed to have the highest influence to dissect the fishpond levees in Multi-resolution segmentation, thus these layers are vital in the classification process. Geometrical features such as: number of pixels, compactness and elliptic fit were observed to be useful in separating fishpond areas from the other water bodies.
Accuracy assessment report
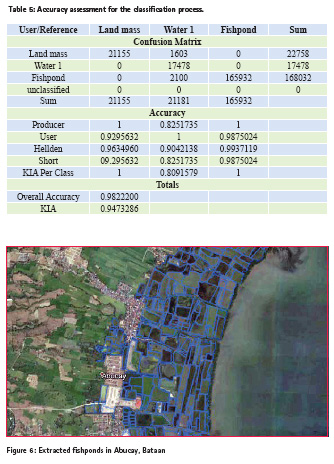
Accuracy assessment was done to evaluate the classification process was carried out in extracting fishponds structures. It was observed that the classification process obtained high accuracy of 98.22% with a kappa coefficient of 0.94. Results of the accuracy assessment is shown in Table 5.
Figure 6 shows the final classified map of fishpond structures using the combined approached of Support Vector Machine and Rule based classification.
Conclusion
Proper scaling and weighing values are vital in using Multi-threshold and Multi-resolution segmentation to separate different classes. “Support Vector Machine” and “Rule based Classification” effectively extracted large number of fishpond structures in Samal and Abucay, Bataan. The study shows that using the modified method for classifying fishpond structures, an accuracy of 90+ can be obtained putting only height dependent layers of the LiDAR data. Accuracy may vary by using different layers and remotely sensed data.
Acknowledgement
We would like to acknowledge the Department of Science and Technology (DOST) for funding support for the Phil-LiDAR 2 Program, and Philippine Council for Industry, Energy and Emerging Technology Research and Development (PCIEERD) as the program monitoring agency.
References
[1] Auria, L., and Moro, R., 2008. Support Vector Machines (SVM) as a Technique for Solvency Analysis. Deutsches Institut für Wirtschaftsforschung. Discussion Papers, pp. 2
[2] Baatz, M., and Schäpe A., 2000. “Multiresolution segmentation: An optimization approach for high quality multi-scale image segmentation” in Proceeding. 12th Angewandte Geographische Informationsverarbeitung, pp. 12–23.
[3] Rees, G., 2005. The Remote Sensing Data Book Cambridge University, United Kingdom, pp. 114
[4] Pradhan, A., 2012 “Support Vector Machine – A Survey” International Journal of Emerging Technology and Advanced Engineering, Volume 2, Issue 8
[5] Travaglia, C., Profeti, G.,Aguilar-Manjarrez, J., Lopez, N.A. 2004. Mapping coastal aquaculture and fisheries structures by satellite imaging radar. Case study of the Lingayen Gulf, the Philippines. FAO Fisheries Technical Paper. No. 459. Rome, FAO. 2004. 45p
[6] www.mimuw.edu.pl


 (No Ratings Yet)


Leave your response!